
Available on versions 7.14.0 and above.
We are introducing a new way to view your most important metrics right from your Flex Home Dashboard. The Insights Carousel offers a snapshot of your practice’s financial and patient activity performance without needing to open a full report. With 8 interactive insights you can track trends, monitor growth, and stay informed. Each view is easy to navigate and designed to help you understand what is working in your practice and where you may want to take a closer look.
Note: The Insights Carousel is only available to users who have Insights enabled in their Flex user profile. If you do not see the carousel on your dashboard, check with your Flex administrative user to confirm access.
Your Data at a Glance
The Insights Carousel is built to help you stay connected and support awareness, interpretation, and follow-up actions—all from one place. It includes 8 Insights, organized into two focus views:
1. Practice Financial Panel 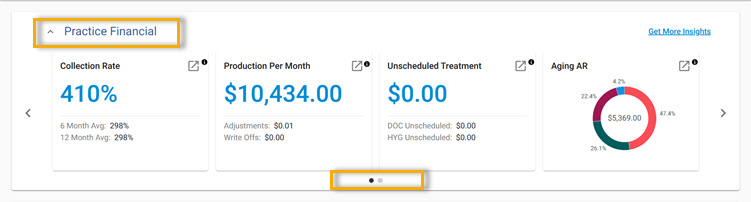
- Collection Rate — The percentage of revenue collected on services rendered over the past 30 days.
This gives insight into how effective your collection and billing process is at bringing in payments. - Production Per Month — The total gross production over the past 30 days.
This provides a clear view of whether you are maximizing scheduled chair time and making full use of provider availability. - Unscheduled Treatment — The total dollar amount of unscheduled treatment from the past 30 days.
This highlights potential revenue that may be lost if recommended treatment is not scheduled. - Aging A/R — The total amount of unpaid balances, broken down by the aging group.
This graph reflects how effective your practice is at collecting outstanding balances over time.
2. Patient Activity Panel 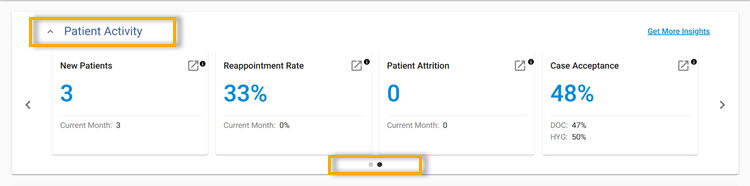
- New Patients — The number of new patients with completed visits in the past 30 days.
This helps track practice growth and gives insight into the impact of your marketing and referral efforts. - Patient Attrition — The number of patients who became inactive in the past 30 days. Patients are considered inactive after 18 months without a visit.
This metric helps you evaluate patient retention and the effectiveness of your recall efforts. - Reappointment Rate — The percentage of patients seen in the past 30 days who have a future appointment scheduled.
This helps gauge patient retention and may reflect how well your team is supporting ongoing care. - Case Acceptance — The percentage of treatment-planned procedures that have been scheduled.
This reflects how effectively your team communicates the importance and cost of recommended treatment.
3. Trend Arrows 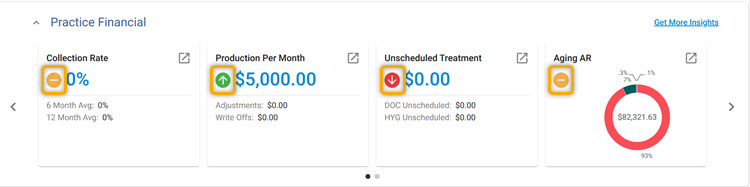
After gathering user feedback, we are comparing the last 30 days with the same 30-day period last year to measure improvements.
- For Production, Collection Rate, New Patients, Reappointment Rate, and Case Acceptance:
- Increase: Green Up Arrow
- Decrease: Red Down Arrow
- Increase: Green Up Arrow
- For Patient Attrition, Aging AR, Unscheduled Treatment:
- Increase: Red Up Arrow
- Decrease: Green Down Arrow
- Increase: Red Up Arrow
- For No Changes on all: Orange Horizontal Line
Using the Insights Carousel
Here is what you can expect when navigating the carousel:
- Scrollable Panels
Use the left ( < ) and right ( > ) arrows to change views and explore more data. - Collapsible View
Collapse and expand the carousel to reduce visual clutter. Click the panel title or use the up ( ^ ) and down ( v ) arrows.
-
Interactive Insights
Select the open arrow icon in the top right of any Insight to view full details. - More Information
Next to the open arrow, click the information icon next to the open arrow for related Help Center articles, and next steps.
Disabling the Insights Carousel (In Beta)
⚠️This is a global setting
To remove the carousel from all user views:
- Log in as an Administrative user
- Access Settings
- Select the Extras tab
- Click the Toggle to update your setting
- Blue: Enabled
- Gray: Disabled
💡Pro Tips for Success
- Make checking your dashboard part of your daily routine to stay updated on key practice metrics and to catch trends early so you can adjust your workflow as needed.
- Engage your team by sharing access to Insights so everyone stays informed and aligned, maintaining focus on your goals. For a closer look at Insights including how to enable them for your team, check out this guide: Analytics - Insights by Flex↗️
- Keep everyone aligned and proactive by discussing Insights from the Carousel during team Huddles. Want to learn more about using the Huddle Report to support your workflow? Explore this guide: Huddle↗️
- Use data to help you prioritize scheduling, billing, and patient outreach. The APL, Insight, and Rapid Fill filters allow you to create a specific list of patients to contact by text. Take a look at these articles to learn more: Advanced Patient List (APL)↗️
- Provide feedback to help us improve and shape future updates.
Next Steps
➡️To learn more about FlexPayments, how to send statements, and automatic patient billing, access FlexPayments resources here: FlexPayments Text Guide Tutorials
➡️Not yet using FlexPayments? Schedule a Demo today: See FlexPayments
➡️If you’re looking to contact a list of patients by email, consider sending a FlexBlast. Reference these guides for more detail: Flex Blast
➡️To send a mass text to a group of patients, use the Advanced Patient List (APL). Check out this guide to learn more: APL Text Guide Resources
You are all set!
If you found this information helpful, please like and/or comment below!
If you have questions, please contact Flex Support.
Thank you!
Comments
Please sign in to leave a comment.